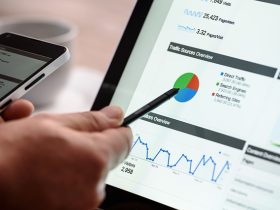
Since the founding of the United States, the American economy has been a subject of global study and admiration. It’s a constantly evolving ecosystem shaped by policies, innovations, market dynamics, and societal shifts. In recent years, many positive factors have been shaping the American economy, impacting various sectors in commendable ways. In this article, we describe how we visualized the positive impact on the American Economy.
Table of Contents
Technological Innovation
Technology has arguably been one of the most significant driving forces of the American economy. The tech industry, centred in Silicon Valley and Seattle regions, has become a worldwide innovation icon. Companies like Apple, Microsoft, Google, and Amazon drive economic growth by creating jobs and fostering innovation.
The surge of new technologies like artificial intelligence, machine learning, and blockchain has opened up fresh avenues for job creation. These jobs don’t just exist in tech firms. Every industry, from agriculture to finance, is digitally transformed, creating a demand for tech-literate workers. The Bureau of Labor Statistics predicts that job growth in tech-related roles will outpace other industries over the next decade.
Renewable Energy Revolution
The renewable energy sector in the U.S. has seen a monumental rise in recent years. With the cost of renewable energy sources such as solar and wind plummeting, they have become increasingly attractive for businesses and consumers. This has led to a surge in green jobs, with the U.S. Bureau of Labor Statistics projecting that wind turbine technicians and solar photovoltaic installers will be among the fastest-growing occupations.
This sector also fosters technological innovation, drives economic growth, reduces dependence on foreign oil, improves energy security, and helps combat climate change. The growth of the renewable energy industry is creating ripple effects in local economies, from rural areas where wind and solar farms are being built to cities where manufacturing and corporate jobs are being made.
Healthcare and Biotech Boom
The healthcare industry has been another significant contributor to the American economy. This sector is booming from major pharmaceutical companies to startups focusing on biotech, digital health, and telemedicine. The global pandemic has accelerated this growth by highlighting the importance of robust healthcare infrastructure.
The biotech industry in the U.S. is leading the charge in developing novel therapies and medical technologies, bringing jobs and investments into the country. Additionally, digitising healthcare creates many opportunities in health informatics, telemedicine, and other tech-enabled health services.
Investment in Infrastructure
Investments in infrastructure are known to provide a substantial boost to the economy. Recent infrastructure spending has aimed at updating and expanding the nation’s ageing roads, bridges, public transport, and broadband access. These investments stimulate economic growth in the short term by creating construction and engineering jobs. Improved infrastructure can reduce business costs and improve productivity in a long time.
Global Trade Relationships
Trade relationships with other nations also significantly impact the American economy. Recent years have seen the U.S. renegotiating key trade agreements, aiming for more favourable conditions for domestic industries. While trade relations can be contentious, they are crucial for economic growth, providing markets for American goods and services and promoting competition, which spurs innovation.

Frequently asked the question about Visualized: How positively impact on American Economy.
Certainly! Here are some frequently asked questions about visualizing the positive impact on the American economy:
How can data visualization help understand the positive impact on the American economy?
Data visualization can display complex economic data such as employment rates, GDP growth, stock market performance, etc. By presenting these data points visually, it becomes easier to understand trends, see correlations, and identify sectors driving positive economic impact.
What are some examples of data visualization illustrating a positive impact on the American economy?
Examples may include graphs showing job growth in tech or renewable energy sectors, charts depicting increases in GDP over time, or maps showing the geographical distribution of new infrastructure projects.
What type of data visualization is best to show economic growth?
The best type of visualization depends on the data and the message one wants to convey. Line graphs often show changes over time, like GDP growth. Bar charts could illustrate job growth in various sectors, and maps could show the geographical distribution of economic growth.
What tools can I use to visualize the impact on the American economy?
Many tools can be used for economic data visualization, including Tableau, Microsoft Power BI, and Google Charts. These tools can handle large datasets and offer various visualization options.
Where can I find data on the American economy for visualization?
Several reliable sources for economic data include the U.S. Bureau of Economic Analysis, the U.S. Census Bureau, the Federal Reserve, and the U.S. Bureau of Labor Statistics. Many of these organizations provide access to this data for free.
Can data visualization show the future trends of the American economy?
While data visualization can’t predict the future with certainty, it can help forecast potential trends based on existing data. Economic forecasting models often use visualizations to illustrate possible future scenarios.
How can data visualization be used to compare the American economy with other countries?
Data visualization can help compare the American economy with other countries by presenting metrics like GDP, unemployment rate, or inflation rate side by side. These comparisons can be made using bar charts, line graphs, or even maps for a clear and immediate understanding of the disparities and similarities.
What role does data accuracy play in visualizing the American economy?
Data accuracy is crucial in any data visualized. When visualizing the American economy, inaccurate data can lead to misleading conclusions about economic trends and impacts. It’s always important to use reliable sources for financial data.
Conclusion
The American economy is on an upward trajectory, fueled by technology, renewable energy, healthcare, infrastructure, and global trade. These sectors’ combined impact, visualized, forms an impressive image of sustained growth and resilience. It’s a testament to the power of innovation, investment, and the ever-evolving dynamism of the American economy. The focus on these key areas will continue to drive positive economic outcomes.


Leave a Reply